

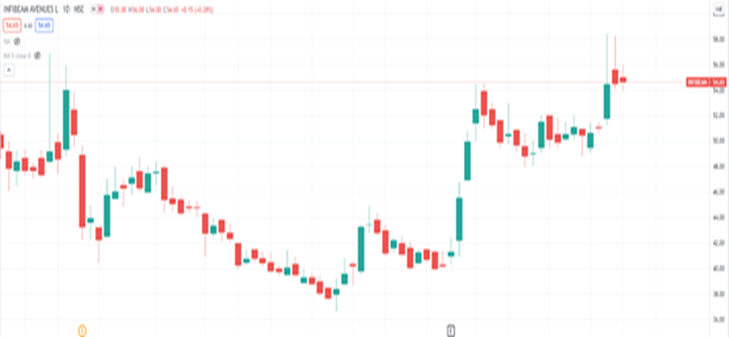
Analysing different parameters before investing in a company’s shares is important before taking any investment decision. One of the techniques to determine the performance of a stock is reading stock charts & can invest in stocks that can gain profit. A stock chart is essentially a graphical representation of the stock prices over a specific time period.
Compared to other types of charts like bar charts, line charts, etc., a candlestick stock chart is considered to be easier to interpret.
What is a candlestick pattern?
It provides a glimpse of the market trend and indicates the movement of a stock on a particular day.
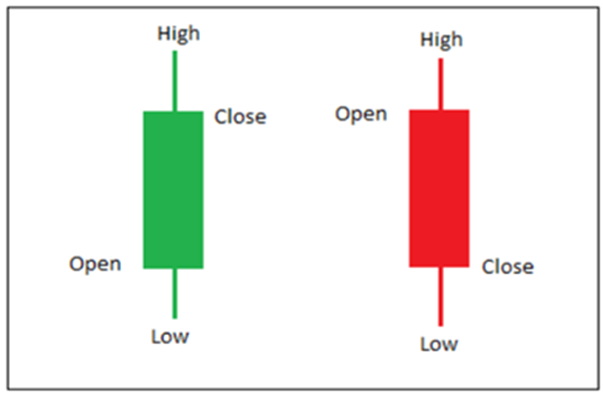
Image source: https://www.definedge.com/candlestick-patterns/
We can deduce four things from every candlestick chart:
1) Shadow of the candlestick:
- a) High: The highest price on that day
- b) Low: The lowest price on that day
2) The body of the candlestick:
- a) Open: Open price on that day, i.e., at 9:15 AM
- b) Close: Closing price on that day, i.e., at 3:30 PM
The presence of a green candlestick in the chart means that the stock opened at a lower price and closed at a higher price. Similarly, the presence of a red candlestick in the chart means that the stock opened at a higher price and closed at a lower price.
How to read candlestick patterns?
There are two types of candlestick patterns – bullish patterns and bearish patterns.
Bullish Patterns: Bullish patterns may form after a market downturn and signal a reversal of price movement. So, the formation of bullish patterns indicates that prices can rise soon.
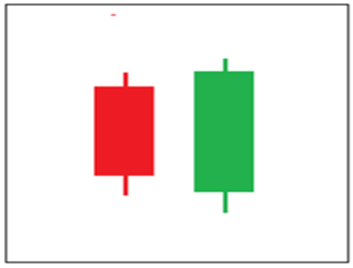
| · Bullish engulfing
|
The green candlestick completely covers the red candlestick of the previous day. This pattern forms when there are chances of a trend reversal. |
| · Bullish marubozu
|
This candlestick has a big body and negligible shadow. It shows that the buyers are willing to buy the stock at any price. So, the price of the stock will significantly increase. |
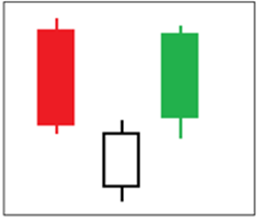
| · Morning star
|
A morning star is a visual pattern that consists of three candlesticks. It generally forms after a downward trend and indicates the start of an upward climb. |
Bearish patterns: Bearish patterns may form after a market uptrend and signal a reversal of price movement. The formation of bearish patterns indicates that prices can fall in the near future.
| · Bearish engulfing
|
The red candlestick completely covers the green candlestick of the previous day. It indicates that the price of the stock could decrease in the near future. |
| · Bearish marubozu
|
This candlestick has a big body and negligible shadow. It shows that the sellers are eager to sell the stock at any price. |
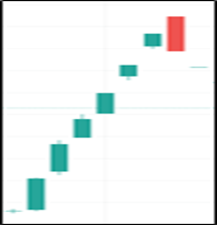
| · Evening star
|
An evening star is a visual pattern that consists of three candlesticks. It generally forms after an upward trend and indicates the start of a downward trend. |
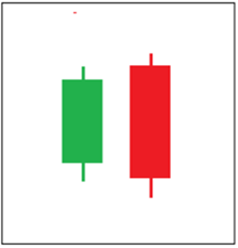
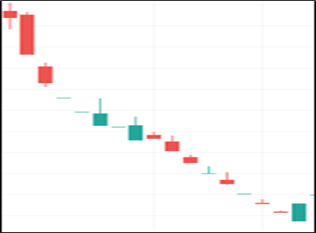
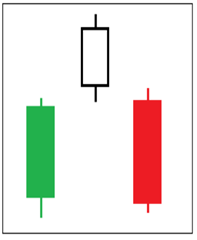
Image Sources
Investing in stocks – Is it for you?
Candlestick patterns help investors in making their day trading strategies successful. If you are looking to start investing in stock market, it is prudent to do it under expert guidance so that your investment plans are aligned with your goals and risk appetite.
Reach out to an expert today and achieve your dreams by investing in the right instruments.
Comments are closed.